


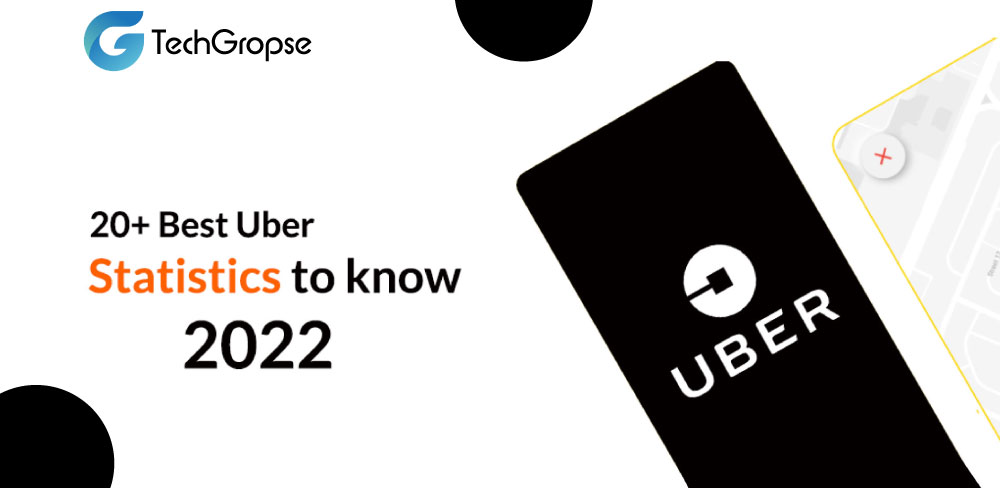
Are you doing some research on Uber Statistics? Then this blog is for you, here you will find Best Uber Statistics.
Uber is transforming how we travel. By just clicking, this ride-sharing app allows users to locate drivers with a single click. Money cannot be exchanged. In comparison to regular taxi services, Uber provides more pleasant transportation options. Additionally, driving autos can generate some income for drivers. Uber runs really effectively. For connecting drivers to riders, this network takes up 2% of the transactions.
Uber Technologies, Inc. offers services such as peer-to-peer ridesharing, smartphone ride-hailing, car and bike rentals, and food delivery. It is built on the on-demand model for creating apps.
Uber has revolutionized the way people use transportation generally and is best recognized for its ridesharing service. It used to be challenging for folks to find a cab when they needed one before Uber, but ever since its launch, a cab is a tap away.
Think of how amazing it is that in advanced times today we can get a ride from or to home just with our phone. Uber has announced that they are adding Uber Air to their service offering, enabling on-demand helicopter flights.
We now know that Uber faces a plethora of competitors in the same region. So how can we determine which one is the best? In this blog, we have compiled a list of 20+ Uber statistics that demonstrate the rising popularity and demand for Uber.
1. Uber is Accessible in More than 10,000 Cities Worldwide.
Source: Uber, GoBanking Rates
The business has had consistent growth over the past few years. At the current time, Uber accepts rides from as many as 10,000 different cities globally. Lyft, in contrast, is accessible in more than 640 US cities as well as Puerto Rico.
According to statistics on Uber usage by city, the most frequent use of Uber is seen in five locations worldwide, where it accounts for 22% of all rides. New York City, So Paulo, Los Angeles, London, and Chicago are among them.
2. In 2019, it was estimated that Uber was worth up to $90 billion.
Source: Uber Investor
Uber statistics growth figures demonstrate that the business has consistently outperformed the competition, even in past years. From just $3.8 billion in 2016 to a staggering $11.2 billion in 2018, its income surged dramatically.
The bulk of these profits came from gross booking, which is Uber’s key industry. In just two years, it increased from $18.8 billion in 2016 to $41.5 billion today.
3. In 2021, Uber’s gross bookings increased to $25.9 billion.
Source: BBC
It has increased by 51% year over year, exceeding the upper limit of the projected range.
Additionally, the company’s adjusted EBITDA hit $86 million and its net income exceeded $892 million.
4. Every three months, the company drives 1.44 billion miles.
Source: Backlinko
Any completed trip or delivery arranged through the app is referred to as a “trip.”
Uber’s usage statistics show that at the end of 2017, the ride-hailing company broke the record of 1 billion quarterly rides.
However, the number of Uber rides decreased overall by 24.21% in 2020 when the pandemic hit. Fortunately, Uber wasn’t one of the approximately 2,000 companies that shut down due to the pandemic.
5. The annual revenue from service fees for Uber is $6.1 billion.
Source: Backlinko
Each ride planned through the company’s platform carries a service fee, which goes toward the company’s mobility (ridesharing) revenue.
Additionally, according to data from the Uber app, this mobility category generated over $10 billion in income in 2016, the numbers went up by $6.89 billion in 2017 and a whopping $10 billion in 2019.
6. In five states, Uber’s average fare for a 5.5-mile trip is less expensive than that of its rivals.
Source: Brainvire
Statistics state that in some cities, the margin of Uber statistics estimates is much less expensive than other services for the majority of trips.
Remember that only UberX, which is less expensive than other options like Uber Black, is covered by this information. UberX, which is the least expensive mode of transportation among all Uber services, is offered at a higher price than all other Uber services.
The study chart shows that the cost of a ride in Boston, Chicago, Dallas, Dubai, Saudi Arabia, Kuwait and Bahrain and Los Angeles ranges from $5 to $20. However, in New York, the price is $30, and the competition is likewise at that price.
Uber offers better services at lesser rates than its competitors, and this sure is one of the main reasons behind its success of it.
7. In only one week in 2017, Uber saw a 5% decline in market share.
Source: Bloomberg Second Measure
The #DeleteUber hashtag became widely popular this year. The former CEO, Travis Kalanick, resigned in the wake of this issue and others, as well as problems with the corporate culture.
Uber was able to get back on track with the support of his replacement and the relaunch in 2018. With a 72% market share today, the firm continues to rule the ride-sharing industry. Amazon only holds a 40% market share in comparison to the company that dominates the retail sector.
Read also: What is Taxi Booking App Development? Its Cost and Key Features.
8. In 2020, Uber Statistics recorded 4.89 billion trips
Source: RideStar
Uber was quite well-known even a few years back. Around 6.9 billion trips were made with this company at that time. Furthermore, there were 2.96 billion travels in the second quarter of 2021.
But how many Uber rides occur each day? Every day, Uber offers around 15 million rides.
9. About 50,000 new drivers are hired by Uber each month.
Source: Lawyer Friend
Due to its rapid expansion, Uber must continue hiring a sizable number of new drivers.
And so it is: According to estimates, Uber hires 50,000 new drivers each month. Currently, it includes well over three million drivers, largely as a result of the increase in Uber users.
10. In 2023, the global user penetration is projected to be 10.6%.
Source: Statista
Currently, 8.1% of people worldwide use ride-hailing services.
By 2023, the revenue is anticipated to surpass $133 billion with a 12.8% annual growth rate.
Competitors in the ride-sharing uber like app development market are not too pleased about this.
11. 40.9% of the employees at Uber are female.
Source: Statista
Uber has been improving the gender diversity of its employees, according to Statista. Males make up 59.3% of all employees while females make up 40.9%. The aforementioned statistics exclude drivers and solely include employees who are directly employed by Uber.
Uber’s inclusion of both genders accounts for the rise in the percentage. This demonstrates that chances are provided for everyone.
12. In 16 out of 20 major US cities, the research found that Uber is more affordable than a cab.
Source: LifeWire
According to Uber statistics broken down by city, in several cities, including Los Angeles, San Francisco, and Detroit, Uber is less expensive than taxis. Taxis, on the other hand, are less expensive in New York.
More exactly, a cab in New York costs $2.50 upfront and 50 cents for every 15 miles, whereas UberX costs $2.55 upfront, 35 cents per minute, and $1.75 for every mile.
13. When driving, 58.7% of drivers only use Uber.
Source: Brainvire
Uber is a business that provides transportation for customers while also giving drivers an opportunity to make money. To successfully implement their business model and revenue source, they must pay attention to the needs of both customers and drivers. According to a recent poll, 58.7% of US drivers favor Uber over other services. This is due to the enormous progress Uber has made in comprehending and meeting users’ demands.
14. In 2020, Uber had 118 investors.
Source: CrunchBase
Due to its size, Uber has attracted a wide range of investors. In fact, evidence indicates that as many as 118 investors had money invested in Uber in 2020. Toyota and Paypal are among the significant investors.
15. Uber drivers span a wide spectrum of ages
Source: Brainvire
Uber statistics show that the age range of Uber drivers is 18 to 61 or older. The rate of average hourly pay might change depending on a number of factors. This discussion is about the standard rate, not about denying this reality.
16. The hourly rate for Uber drivers between the ages of 18 and 30 is $17.98
Source: Brainvire
According to the graph below, drivers between the ages of 18 and 30 make the greatest money ($17.98 per hour), followed by those between the ages of 31 and 40 ($17.17 per hour). The 40–49 age bracket makes an average hourly wage of $16.45. The average hourly rate for drivers aged 61 and over is $14.57. The popularity of Uber is still rising, so its revenue keeps on increasing too with time.
17. Each fare is subject to a 25% fee by Uber.
Source: DoughRoller
According to Uber statistics, the fares that its drivers receive, Uber apparently takes a quarter of the. However, Lyft, a key rival of Uber, only requires its drivers to give up 20% of their earnings.
The question of whether driving for Uber or Lyft would pay more money, however, cannot be answered with certainty.
This is due to the fact that their income would vary depending on a variety of factors, including the type of vehicle they drive, how frequently they drive, when they drive (prime time rates/surge pricing), and more.
18. More than 5 million people subscribe to Uber.
Source: Backlinko
Uber introduced its monthly pass subscription service in August 2020. Members of this service receive special discounts on rides and deliveries as well as occasionally free deliveries.
The service is currently fully operational in 16 different nations throughout the world, and there are plans to grow.
19. In the US ride-hailing market, Uber holds a 68% market share.
Source: Backlinko
Uber statistics from 2022 show that the ride-hailing company is vastly superior to its rivals.
However, it’s safe to say that Uber’s rivals, like Lyft, are giving the business a run for its money compared to 2015, when it had a 91% market share.
20. Uber has invested approximately $7.25 billion in its automated driving system.
Source: Reuters
Uber made investments in more novel technologies or business models as its growth rate increased (like Uber Eats).
For instance, Uber Technologies, which invests in driverless vehicles among other things, has spent $7.25 billion on these vehicles.
21. In 99.9% of Uber trips, there are no problems with regard to safety.
Source: Uber
Even if accidents and crimes occasionally occur, the great majority of Uber trips are uneventful. Nearly 99.9% of clients are let off the hook.
Unfortunately, sexual harassment exists everywhere in the world, including in rideshare transportation.
Conclusion
Uber is wearing the crown of being the best ride-sharing app which is not to come off anytime soon. In this blog, we have discussed the most important Uber Statistics that you should know. Keep visiting our blogs for more interesting information.
Understanding key industry trends, such as the impact of mobile app development Saudi Arabia, can provide valuable insights into the success of apps like Uber.
Hello All, Aman Mishra has years of experience in the IT industry. His passion for helping people in all aspects of mobile app development. Therefore, He write several blogs that help the readers to get the appropriate information about mobile app development trends, technology, and many other aspects.In addition to providing mobile app development services in USA, he also provides maintenance & support services for businesses of all sizes. He tried to solve all their readers' queries and ensure that the given information would be helpful for them.